
.svg)

Barrow Hanley Credit Partners Monthly Market Update | Yields Surge, AI Slips, & Credit Keeps Its Footing



In this post:

Executive Summary
- Semiconductor equities softened raising concern around the AI trade, but rates did not react positively with long-end rates rising to 19-year highs
- High Yield credit quality continues to trend higher with CCCs hitting record lows as a percentage of the index
- NAIC changed CLO capital charges, likely giving high-quality CLO liabilities a technical positive
Market Recap
July’s markets were defined by rates. Financial markets were mixed in July with duration sensitive assets lagging and Loans outperforming traditional asset classes. Loans posted a +0.80% gain while HY declined -0.29%. IG declined -1.55% and 10-year U.S. Treasuries declined -1.73%. The S&P 500 declined -0.06% and the Russell 2000 declined -3.03%. The 10-year U.S. Treasury rate increased 27bps to 4.74%, hurting duration sensitive assets. The 30-year U.S. Treasury yields increased 32bps, reaching a 19-year high, ending the month at 5.27% (-4.38% return).
Two dominant forces influenced rates: flare-up of the ongoing U.S.-Iran conflict and the accelerating AI investment boom and disruption. The Federal Reserve left rates unchanged at its July meeting. Three voting members dissented in favor of a rate hike, warning that delayed action risks more aggressive tightening later. Half of the 18 policy makers submitted projections favoring raising rates before year-end. The odds for a rate hike in September moved to two-thirds and sell-side economists began publishing outright rate hike calls for December. Oil markets were a central macro transmission mechanism in the month. Global fuel markets were described as having little slack, with wars in the Middle East and Europe pushing refinery utilization to limits and raising supply disruption risk. Oil prices entered the month in the $60’s but shot up to north of $90 before ending the month in the mid-$80s. June’s CPI print of 3.5% year-over-year and 0.4% month-over-month was viewed as soft, but that softness came from energy price declines, which are seemingly less likely to be helpful in the near future.
Semiconductors have been on a tear since March and starting in late June began to give back some of those gains. Mid-July, the Chinese company Moonshot released its open-weight AI model Kimi K3 adding fuel to the downward pressure. In total since mid-June, global semiconductor equities have lost more than $3.3 trillion in global market value. Notably this drawdown did not produce a Treasury rally, instead, investors lost money holding U.S. Treasuries. South Korea’s AI-heavy market experienced a 38% drawdown from its peak and 22% in July. In July, the S&P 500 dropped -2.39% before bouncing the last 2 days of the month to end the month roughly flat. The AI softness during the month did highlight a spectacular story of hubris. Situational Awareness was an AI focused investment firm that was running with significant leverage, reportedly running near 4x. When AI equities softened during the month, it created a reported forced liquidation of roughly $16bn, the whole public equities portfolio, and accelerated downward pressure on AI related securities. Citadel bought the entire public equities book before the open on July 30th, and semis rebounded hard on the removal of a large, forced seller.
Meanwhile, hyperscalers increased their cap-ex plans, and some are now posting negative free cash flow quarters. Hyperscalers incremental annual debt rose from ~9% of cap-ex in 2024 to 32% of capex by mid-2026. In the first 6 months of the year, aggregate debt levels are rising significantly at some of the largest companies. Amazon saw a 42% increase in debt. Alphabet saw an 82% increase in debt. We mentioned Alphabet’s $84.75bn equity raise in last month’s letter. It feels like we are in a race to secure capital and AI’s cap-ex has become a variable influencing rates that needs to be monitored very closely.
High Yield
High Yield returned -0.29% due to the rate-sensitivity. BBs underperformed the index down -0.37%. Single-Bs were down -0.01%, the best performing rating cohort. CCCs were down -0.78%. Spreads were higher by 9bps to 303bps but made up a small portion of the yields, increasing 27bps to 7.42%. BB spreads were higher by 7bps to 193bps. Single B spreads were up 6bps to 321bps. CCC spreads were higher by 61bps to 1,039bps. Spreads have been remarkably steady all year. Year-to-date spread movements are 7bps for the index and BBs, 6bps for Single-Bs and 147bps for CCCs. Quality of the index is a topic we have highlighted in this letter many times, mainly how BBs now make up over 60% of the index. The other end has helped as well, with CCCs now comprising a record low of 8.20% of the index versus a long-term average of 16%. The index started the year at 9.58%, and most of the decline in CCCs is due to upgrades of larger bond complexes. The CCC cohort has declined in quality due to these upgrades leaving the cohort with a yield of 14.75% compared to 12.57% yield to start the year. Spreads are 1,039bps for CCCs and, as mentioned above, higher by 147bps, which helps explain such a large mover versus the other rating cohorts outside of a stressed market.
Loans
Loans were up +0.80% in July led by Single-Bs up +0.97%. BBs were up +0.59%. CCCs were down -0.34%, extending the underperformance of CCCs year to date and in 2025. Year-to-date CCCs are down -3.38% while the index is up +2.17%, BBs up +2.89% and Single-Bs are up 2.45%. This highlights our past comments about believing there was phantom yield (yield investors will not realize) in the lower quality portion of the index. Loan yields increased 16bps to 9.09% while spreads compressed 7bps to 493bps. Forward curves continue to help loan relative value. Year-to-date Loan spreads are higher by 38bps. Technology has been the sole driver of that widening. Ex-Technology loan spreads are 1bps tighter year-to-date at 442bps. Technology loans did lead the way in July making up for some of their underperformance +1.54% in July but still -2.64% year-to-date. At month end Technology loans carried a yield of 11.85% and a spread of 767bps.
Liability Management Exercises' (LME's) are a relatively new nomenclature assigned to activities of certain lenders exploiting documentation at the expense of minority lenders. One of the more notable early examples of this was Serta/Simmons where a majority of lenders exchanged their debt for super-priority liens at the expense of minority lenders and the company subsequently filed for bankruptcy. The minority lenders sued and in December 2024 received a ruling that the company and majority lenders violated the credit agreement by excluding the minority group. The judge rules that "payments received (the exchange) by the majority group, while not cash based, must be shared with the rival group." This month damages were awarded to the minority lenders to the tune of $261mm in damages plus $142mm in interest. This decision will have influence broad impact on how stressed companies attempt to address their debt.
CLOs
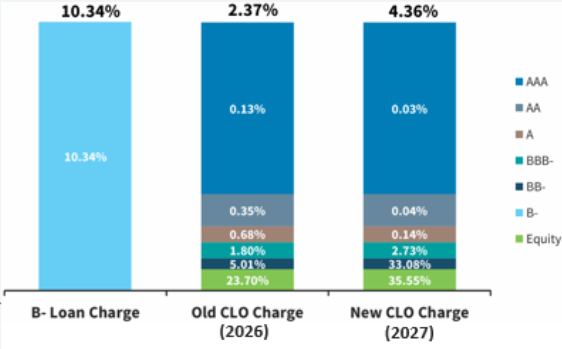
NAIC updated their CLO factors for insurance companies that will go into effect at the end of the year. The changes are beneficial for Single-A and above, reducing the capital charge while increasing the capital charges for BBBs and below. This is a beneficial technical for AAAs through Single-As increasing the insurance company returns for owning this part of a CLOs capital structure. The opposite technical likely influences BBB and BBs. The higher capital charges will lower the return an insurance company will earn owning a BBB through equity piece of a CLO. A stronger senior liability bid from insurance companies is likely to be a net benefit for CLO equity, lowering overall liability costs all else equal. CLO Liabilities were mixed during the month with no big moves one way or the other. AAA spreads were wider by 1bp to 120bps, AA and Single-A spreads were wider by 5bps each to 145bps and 170bps respectively, while BBB spreads were tighter by 5bps to 240bps.
CLO ETFs have been a driving force for the demand for floating rate assets. CLO ETF flows are reported within loan flows which were $2.4bn during July. CLO ETFs comprised +$2.3bn of that demand while Loan ETFs saw an outflow of over $200mm and actively managed funds seeing inflows of a couple hundred million.
Source: Barrow Hanley. Returns represent an asset-weighted composite of all Bank Loan Fixed Income portfolios or High Yield Fixed Income portfolios. Index returns are shown before transaction costs, management fees, and other expenses. Performance is expressed in U.S. currency. Net-of-fee returns are calculated using a model fee. The model fee is based on a $100 million portfolio using our standard fee schedule. Past performance is not indicative of future results. Inception Date for Bank Loans is June 1, 2018. Inception Date for High Yield is January 1, 2005.
General Disclosures:
All opinions included in this report constitute Barrow Hanley’s (BH) judgment as of the time of issuance of this report and are subject to change without notice. This report was prepared by Barrow Hanley with information it believes to be reliable. This report is for informational purposes only and is not intended to be an offer, solicitation, or recommendation with respect to the purchase or sale of any security, nor a recommendation of services supplied by any money management organization. Past performance is not indicative of future results. Barrow Hanley is a value-oriented investment manager, providing services to institutional clients.
Barrow Hanley Credit Partners® is a legally assumed name for the Alternative Credit investment team and investment strategies of Barrow Hanley Global Investors®, including Bank Loan Fixed Income, Collateralized Loan Obligations, and High Yield Fixed Income.
These investment summaries are provided for informational purposes only and should not be viewed as representative of all investments by the firm. This report includes certain “forward-looking statements” including, but not limited to, BH’s plans, projections, objectives, expectations, and intentions and other statements contained herein that are not historical facts as well as statements identified by words such as “expects”, “anticipates”, “intends”, “plans”, “believes”, “seeks”, “estimates”, “projects”, or words of similar meaning. Such statements and opinions contained are based on BH’s current beliefs or expectations and are subject to significant uncertainties and changes in circumstances, many beyond BH’s control. Actual results may differ materially from these expectations due to changes in global, political, economic, business, competitive, market, and regulatory factors. Additional information regarding the strategy is available upon request.
Index Disclosures:
Source: Bloomberg Index Services Limited. BLOOMBERG® is a trademark and service mark of Bloomberg Finance L.P. and its affiliates (collectively “Bloomberg”). Bloomberg or Bloomberg’s licensors own all proprietary rights in the Bloomberg Indices. Neither Bloomberg nor Bloomberg’s licensors approves or endorses this material, or guarantees the accuracy or completeness of any information herein, or makes any warranty, express or implied, as to the results to be obtained therefrom and, to the maximum extent allowed by law, neither shall have any liability or responsibility for injury or damages arising in connection therewith.
Merrill Lynch index data referenced herein is the property of ICE Data Indices, LLC, its affiliates (“ICE Data”) and/or its Third Party Suppliers and has been licensed for use by Barrow Hanley Global Investors. ICE Data and its Third Party Suppliers accept no liability in connection with its use.
Standard and Poor’s and S&P are registered trademarks of Standard & Poor’s Financial Services LLC (“S&P”); Dow Jones is a registered trademark of Dow Jones Trademark Holdings LLC, and these trademarks have been licensed for use by S&P and Dow Jones Indices LLC and S&P Dow Jones Indices LLC. The presentation may contain confidential information and unauthorized use, disclosure, copying, dissemination or redistribution is strictly prohibited. This is a presentation of Barrow Hanley. S&P Dow Jones Indices LLC is not responsible for the formatting or configuration of this material or for any inaccuracy in Barrow Hanley’s presentation thereof.
Frank Russell Company is the source and owner of the trademarks, service marks, and copyrights related to the Russell Indexes. Russell® is a trademark of Frank Russell Company. The presentation may contain confidential information and unauthorized use, disclosure, copying, dissemination or redistribution is strictly prohibited. This is a presentation of Barrow Hanley. Russell Investment Group is not responsible for the formatting or configuration of this material or for any inaccuracy in Barrow Hanley’s presentation thereof.
Please contact us for more information.
214.665.1900
contactus@barrowhanley.com
Barrow Hanley Global Investors
2200 Ross Avenue
31st Floor Dallas, TX 75201
www.barrowhanley.com
Market Recap
July’s markets were defined by rates. Financial markets were mixed in July with duration sensitive assets lagging and Loans outperforming traditional asset classes. Loans posted a +0.80% gain while HY declined -0.29%. IG declined -1.55% and 10-year U.S. Treasuries declined -1.73%. The S&P 500 declined -0.06% and the Russell 2000 declined -3.03%. The 10-year U.S. Treasury rate increased 27bps to 4.74%, hurting duration sensitive assets. The 30-year U.S. Treasury yields increased 32bps, reaching a 19-year high, ending the month at 5.27% (-4.38% return).
Two dominant forces influenced rates: flare-up of the ongoing U.S.-Iran conflict and the accelerating AI investment boom and disruption. The Federal Reserve left rates unchanged at its July meeting. Three voting members dissented in favor of a rate hike, warning that delayed action risks more aggressive tightening later. Half of the 18 policy makers submitted projections favoring raising rates before year-end. The odds for a rate hike in September moved to two-thirds and sell-side economists began publishing outright rate hike calls for December. Oil markets were a central macro transmission mechanism in the month. Global fuel markets were described as having little slack, with wars in the Middle East and Europe pushing refinery utilization to limits and raising supply disruption risk. Oil prices entered the month in the $60’s but shot up to north of $90 before ending the month in the mid-$80s. June’s CPI print of 3.5% year-over-year and 0.4% month-over-month was viewed as soft, but that softness came from energy price declines, which are seemingly less likely to be helpful in the near future.
Semiconductors have been on a tear since March and starting in late June began to give back some of those gains. Mid-July, the Chinese company Moonshot released its open-weight AI model Kimi K3 adding fuel to the downward pressure. In total since mid-June, global semiconductor equities have lost more than $3.3 trillion in global market value. Notably this drawdown did not produce a Treasury rally, instead, investors lost money holding U.S. Treasuries. South Korea’s AI-heavy market experienced a 38% drawdown from its peak and 22% in July. In July, the S&P 500 dropped -2.39% before bouncing the last 2 days of the month to end the month roughly flat. The AI softness during the month did highlight a spectacular story of hubris. Situational Awareness was an AI focused investment firm that was running with significant leverage, reportedly running near 4x. When AI equities softened during the month, it created a reported forced liquidation of roughly $16bn, the whole public equities portfolio, and accelerated downward pressure on AI related securities. Citadel bought the entire public equities book before the open on July 30th, and semis rebounded hard on the removal of a large, forced seller.
Meanwhile, hyperscalers increased their cap-ex plans, and some are now posting negative free cash flow quarters. Hyperscalers incremental annual debt rose from ~9% of cap-ex in 2024 to 32% of capex by mid-2026. In the first 6 months of the year, aggregate debt levels are rising significantly at some of the largest companies. Amazon saw a 42% increase in debt. Alphabet saw an 82% increase in debt. We mentioned Alphabet’s $84.75bn equity raise in last month’s letter. It feels like we are in a race to secure capital and AI’s cap-ex has become a variable influencing rates that needs to be monitored very closely.
High Yield
High Yield returned -0.29% due to the rate-sensitivity. BBs underperformed the index down -0.37%. Single-Bs were down -0.01%, the best performing rating cohort. CCCs were down -0.78%. Spreads were higher by 9bps to 303bps but made up a small portion of the yields, increasing 27bps to 7.42%. BB spreads were higher by 7bps to 193bps. Single B spreads were up 6bps to 321bps. CCC spreads were higher by 61bps to 1,039bps. Spreads have been remarkably steady all year. Year-to-date spread movements are 7bps for the index and BBs, 6bps for Single-Bs and 147bps for CCCs. Quality of the index is a topic we have highlighted in this letter many times, mainly how BBs now make up over 60% of the index. The other end has helped as well, with CCCs now comprising a record low of 8.20% of the index versus a long-term average of 16%. The index started the year at 9.58%, and most of the decline in CCCs is due to upgrades of larger bond complexes. The CCC cohort has declined in quality due to these upgrades leaving the cohort with a yield of 14.75% compared to 12.57% yield to start the year. Spreads are 1,039bps for CCCs and, as mentioned above, higher by 147bps, which helps explain such a large mover versus the other rating cohorts outside of a stressed market.
Loans
Loans were up +0.80% in July led by Single-Bs up +0.97%. BBs were up +0.59%. CCCs were down -0.34%, extending the underperformance of CCCs year to date and in 2025. Year-to-date CCCs are down -3.38% while the index is up +2.17%, BBs up +2.89% and Single-Bs are up 2.45%. This highlights our past comments about believing there was phantom yield (yield investors will not realize) in the lower quality portion of the index. Loan yields increased 16bps to 9.09% while spreads compressed 7bps to 493bps. Forward curves continue to help loan relative value. Year-to-date Loan spreads are higher by 38bps. Technology has been the sole driver of that widening. Ex-Technology loan spreads are 1bps tighter year-to-date at 442bps. Technology loans did lead the way in July making up for some of their underperformance +1.54% in July but still -2.64% year-to-date. At month end Technology loans carried a yield of 11.85% and a spread of 767bps.
Liability Management Exercises' (LME's) are a relatively new nomenclature assigned to activities of certain lenders exploiting documentation at the expense of minority lenders. One of the more notable early examples of this was Serta/Simmons where a majority of lenders exchanged their debt for super-priority liens at the expense of minority lenders and the company subsequently filed for bankruptcy. The minority lenders sued and in December 2024 received a ruling that the company and majority lenders violated the credit agreement by excluding the minority group. The judge rules that "payments received (the exchange) by the majority group, while not cash based, must be shared with the rival group." This month damages were awarded to the minority lenders to the tune of $261mm in damages plus $142mm in interest. This decision will have influence broad impact on how stressed companies attempt to address their debt.
CLOs
NAIC updated their CLO factors for insurance companies that will go into effect at the end of the year. The changes are beneficial for Single-A and above, reducing the capital charge while increasing the capital charges for BBBs and below. This is a beneficial technical for AAAs through Single-As increasing the insurance company returns for owning this part of a CLOs capital structure. The opposite technical likely influences BBB and BBs. The higher capital charges will lower the return an insurance company will earn owning a BBB through equity piece of a CLO. A stronger senior liability bid from insurance companies is likely to be a net benefit for CLO equity, lowering overall liability costs all else equal. CLO Liabilities were mixed during the month with no big moves one way or the other. AAA spreads were wider by 1bp to 120bps, AA and Single-A spreads were wider by 5bps each to 145bps and 170bps respectively, while BBB spreads were tighter by 5bps to 240bps.
CLO ETFs have been a driving force for the demand for floating rate assets. CLO ETF flows are reported within loan flows which were $2.4bn during July. CLO ETFs comprised +$2.3bn of that demand while Loan ETFs saw an outflow of over $200mm and actively managed funds seeing inflows of a couple hundred million.
Source: Barrow Hanley. Returns represent an asset-weighted composite of all Bank Loan Fixed Income portfolios or High Yield Fixed Income portfolios. Index returns are shown before transaction costs, management fees, and other expenses. Performance is expressed in U.S. currency. Net-of-fee returns are calculated using a model fee. The model fee is based on a $100 million portfolio using our standard fee schedule. Past performance is not indicative of future results. Inception Date for Bank Loans is June 1, 2018. Inception Date for High Yield is January 1, 2005.